Record Data
1) Record data description
The dataset used in this part is a subset of dataset from data gathered from clincialtrial.gov API. It has combination of qualitative and quantitative data, and 244 rows.
The data frame has label column which suggest the overall status of the clinical trials. 122 rows data has label completed
and 122 rows of label terminated
.
Record dataset
2) Models & Results for NB with record data
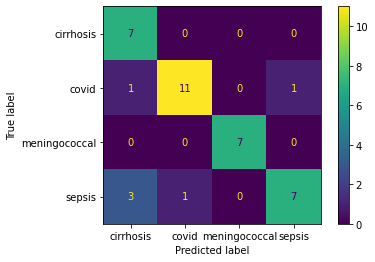
The NB model on record data has accuracy of 0.77 on predicting whether a clinical trial is completed or terminated based on the conditions of clinical trialss. Figure 1 has suggest the relatively higher accuracy, 23/27, on predicting the terminated clinical trial. While the accuracy for predicting the completed trials is 2/3.
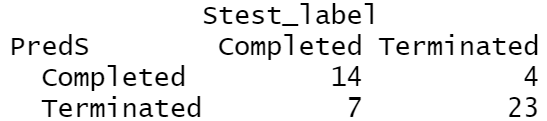
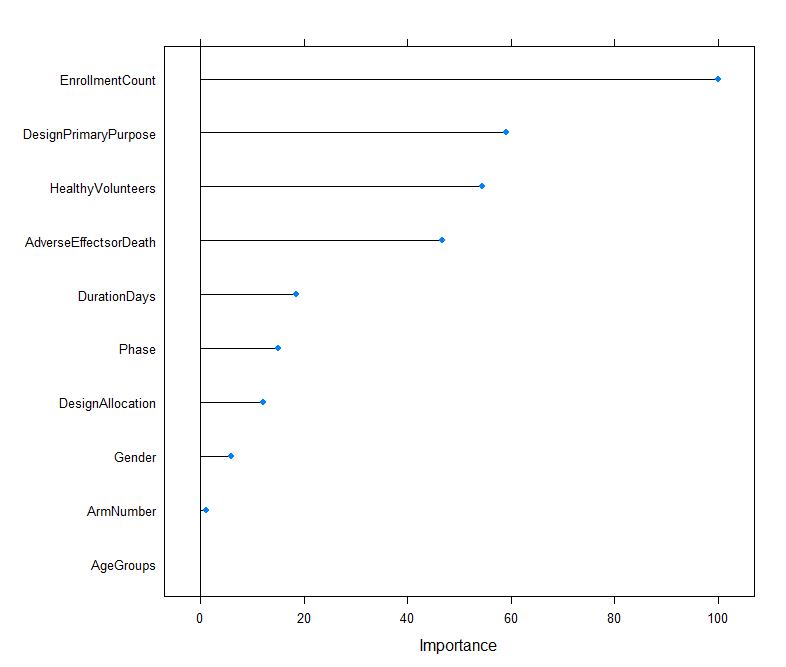
Figure 2 suggests the ranking of importance on different attributes when predicting the labels. EnrollmentCount has play important role in predicting the label, DesignPrimaryPurpose ranks second, as well as HealthyVolunteers, and AdverseEffectsorDeath ranks after. This indicate that by knowing the information of size of the enrolment, the primary purpose of design, whether accept healthy volunteers, and the rate of adverse effect or death, it is possible to predict whether a trial would be completed or terminated, thus help investigator to make wise decisions on funding or engaging on a clinical trials.
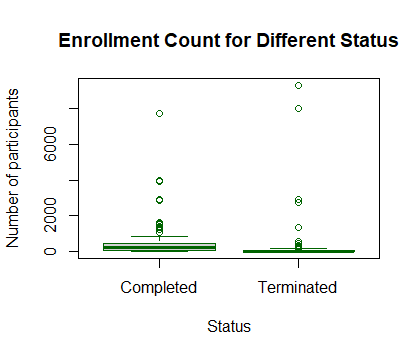
This boxplot has shows that the total number of participants enrolled in completed trials are slightly higher than that in terminated trials.
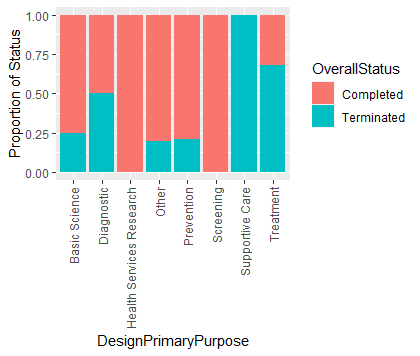
The trials with design primary purpose on health services research and screening has the highest proportion of completeness. While the trials designed primarily for supportive care has the lowest proportion of completeness, as well as the trials with treatment purpose has the second lowest percentage.
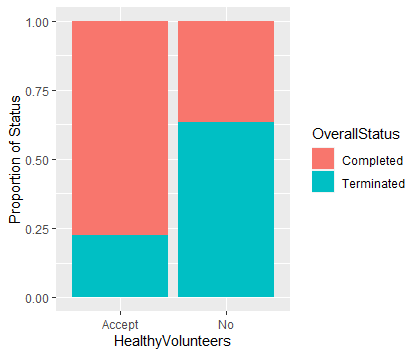
The trials accept healthy volunteers has percentage of completeness more than twice higher than the trials that do not.
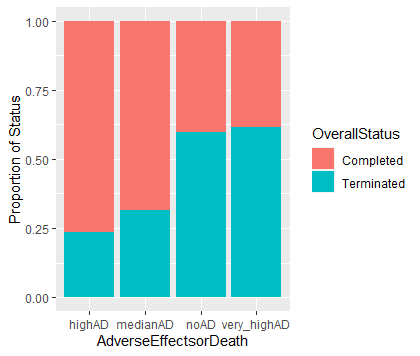
The bar chart shows that the trials with median and high adverse effect rates are likely to be completed than the trials with no or very high adverse effects rate.