Links of Dataset & Codes:

R code for SVM for record data
record data set
Python code for modeling NB and SVM on text data
text data set

Record Data

1) Record data description


In order to train SVM model, all the data except the label should be quantitative. The dataset used here is a subset of gathered data from clinicaltrials.gov API, which have four quantitative columns, AdverseEffectsorDeath, DurationDays, EnrollmentCount and ArmNumber, as well as one label column OverallStatus.


Record dataset


2) Models & Results for SVM with record data


Figure 1 has shown a broad overview of correlation among all attributes in the dataset. It is hard to tell the general relationship among these graphs.


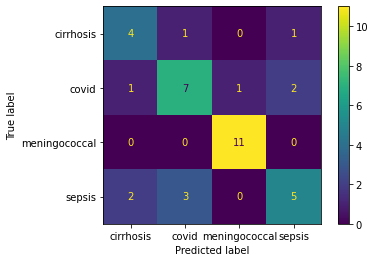
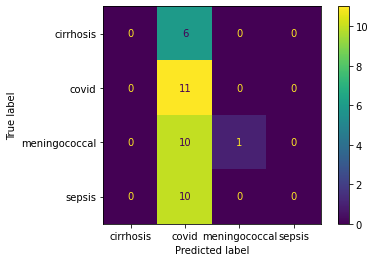
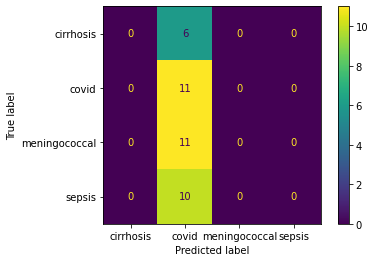
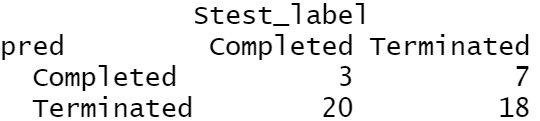
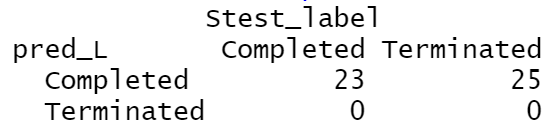
Train the data with polynomial SVM, it has the accuracy of 43%. The confusion matrix has suggest the low accuracy on predicting the completed trials, 13%, and a median accuracy on predicting the terminated trials, 72%. What is more, the models trained with linear SVM and radial SVM have similar accuracy at 48% and 43%, respectively.


Fig.1 - overview of correlations between variables of record data.

Fig.2 - confusion matrix of predicting labels with polynomial SVM on record data

Fig.3 - confusion matrix of predicting labels with linear SVM on record data

Fig.4 - confusion matrix of predicting labels with radial SVM on record data

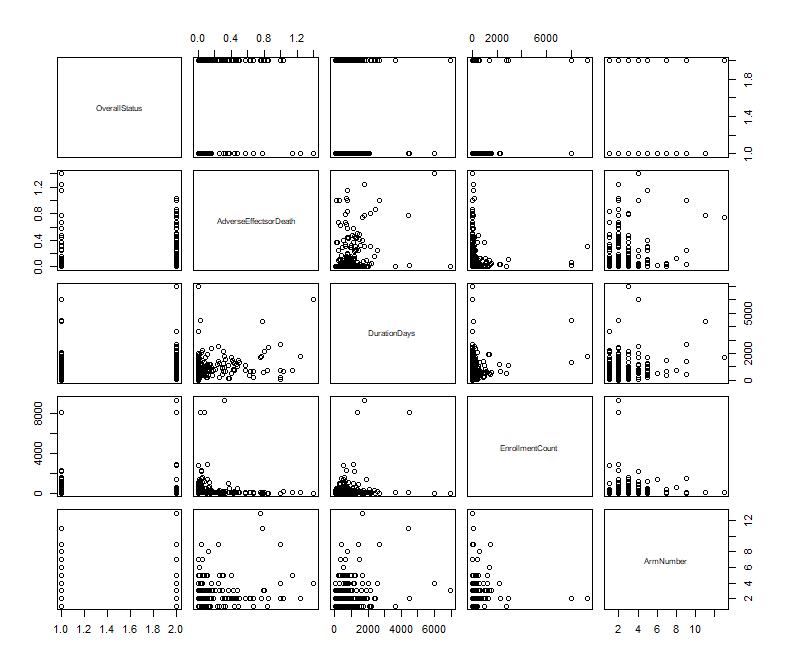
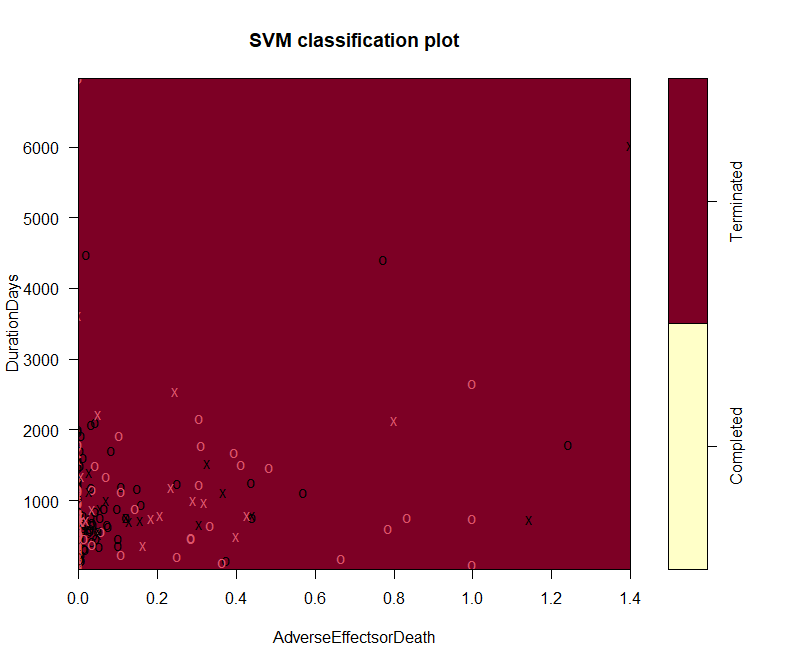
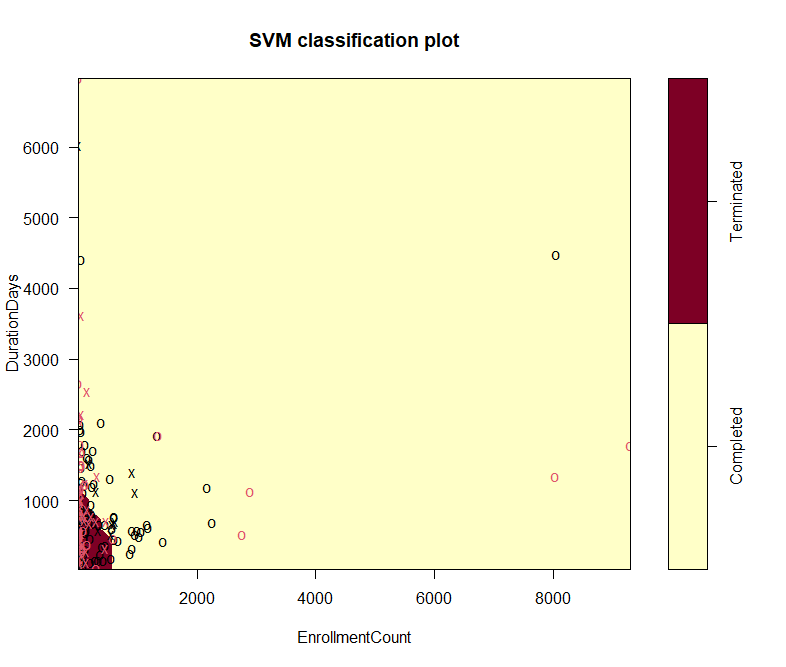
This part presents more detailed plots of four variables. Figure 5 presents the classification of labels along with the columns of AdverseEffectsorDeath vesus DurationDays. This plot does not show clear correlation between these two columns. A large proportion of data are lying within the classification of completed trials, though they should be around evenly distributed into both parts. Figure 6 shows the different distribution of labels, based on prediction, in the correlation plot of EnrollmentCount vesus DurationDays. Similarly, this graph does not suggest the these two factors have correlation, either.


Fig.5 - distribution of labels in the graph of AdverseEffectsorDeath vesus DurationDays

Fig.6 - distribution of labels in the graph of EnrollmentCount vesus DurationDays

Fig.7 - distribution of labels in the graph of AdverseEffectsorDeath vesus EnrollmentCount

Text Data


The SVM here share the same text dataset as the one in the naive bayes and decision tree section. Here train 3 SVM with different parameters. The SVM train with C=1 shows the highest accuracy of 0.79, while the model with ‘rbf’ kernel shows a much lower accuracy at 0.5, and the polynomial model has the accuracy of 0.34.


Fig.8 - confusion matrix of predicting labels of text data with SVM C=1

Fig.9 - confusion matrix of predicting labels of text data with SVM C=1, kernel = ‘rbf’

Fig.10 - confusion matrix of predicting labels of text data with SVM C=100, polynomial kernal

Discussion


SVM has shown a relatively low accuracy on predicting both the text and record dataset. Only the text data trained with polynomial model has shown a relatively higher accuracy. The numeric columns, AdverseEffectsorDeath, DurationDays, EnrollmentCount and ArmNumber do not show any observable any correlation to each other.