Links of Dataset & Codes:
R code for ARM on duration data
Python code for preparing ARM data
Dataset before ARM prepare
Dataset after ARM prepare
Prepare data for ARM
Step 1: Drop the unrelated columns
Step 2: Convert the numeric columns of AdverseEffectsorDeath
, DurationDays
and EnrollmentCount
into qualitative columns by grouping them into different labels.
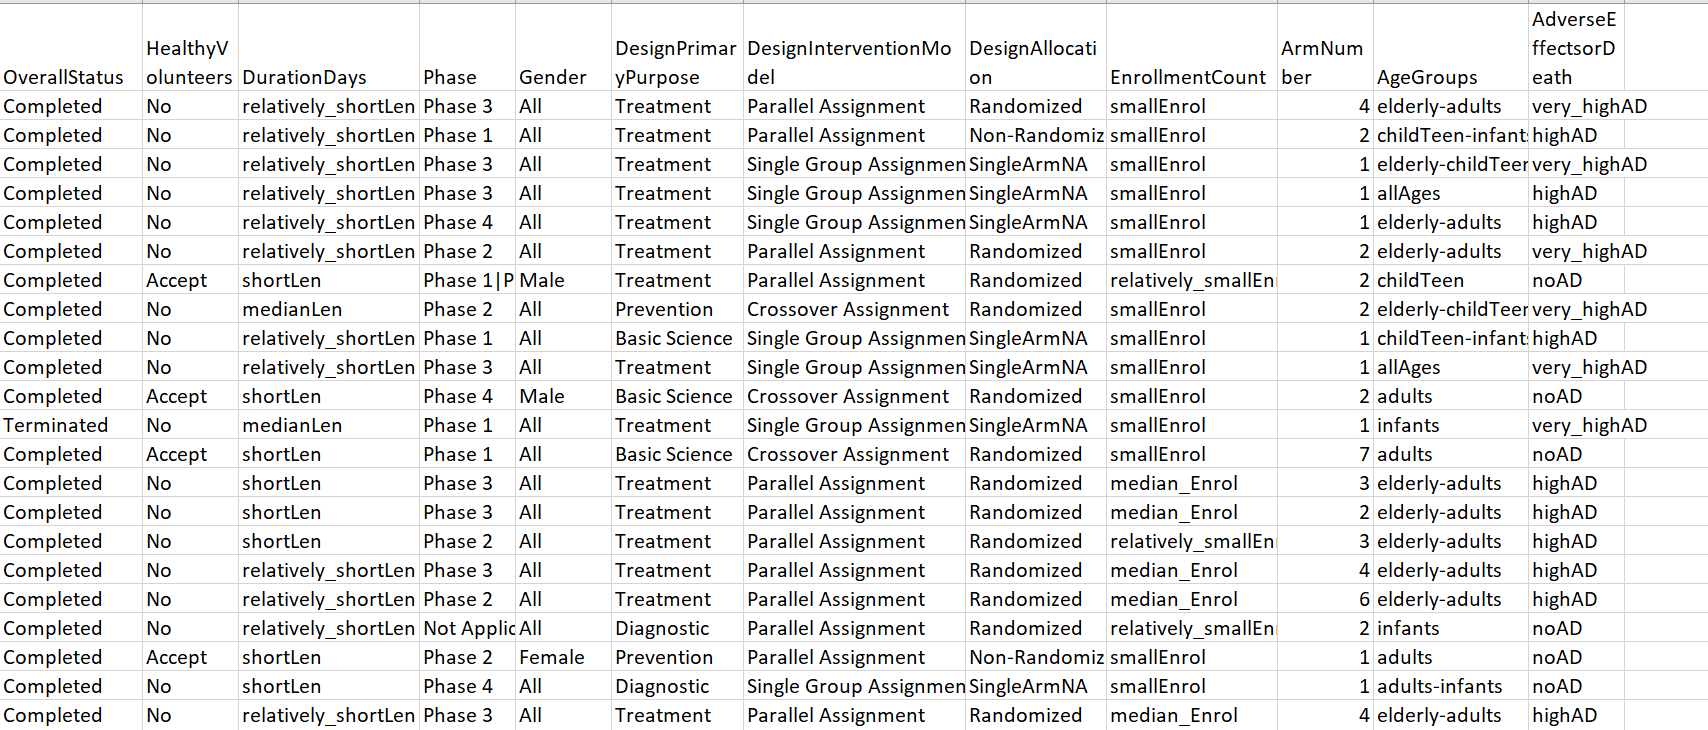
Fig.1 - Prepared Dataset for ARM (link)
Association Rule Mining (ARM) Support, Confidence, Lift
1) ARM introduction
Support is a rule that measuring the frequency of the itemset occurs in the dataset. Confidence measures how frequent of the itemset appear given the presence of other itemset. Lift indicate the independency and association of itemset. The value of lift should be greater than 1 to show associations.
2) Measures of Set Correlation for duration of clinical trials
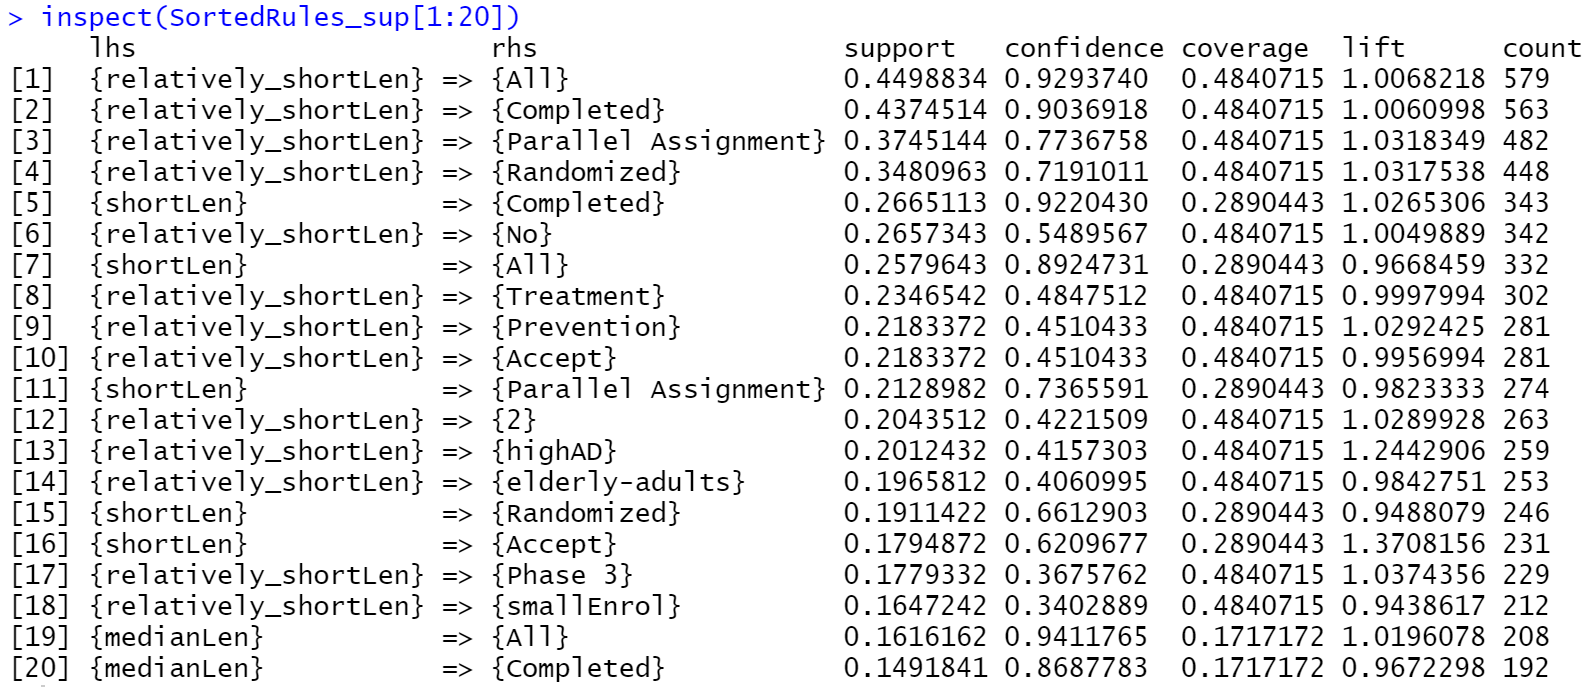
This project use R to code ARM on the prepared dataset. Arules library are used to conduct apriori test. Since the project is interested about how other attributes cause influences on the label column DurationDays
, set the appearance option in apriori as labels within DurationDays
column. The thresholds are set as support=.005, confidence=0.01, minlen=2, which return 167 rules.
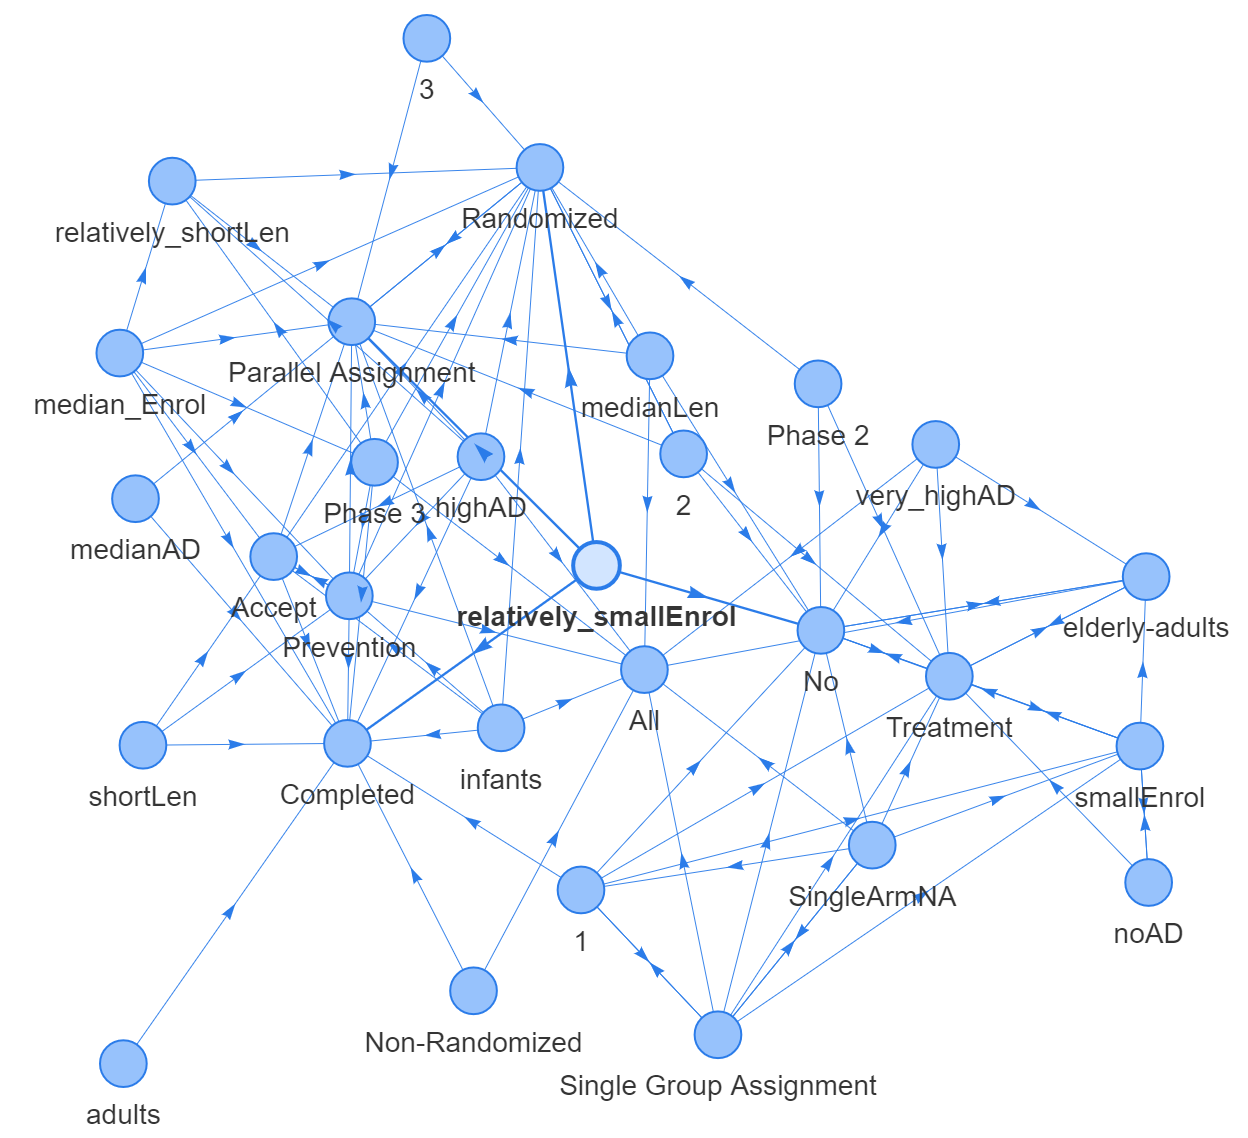
According to fig.2, the itemset {relatively_shortLen, All} has the highest support of 0.45 since it appears in 45% of all dataset. All
is a variable under Gender
column, which means the clinical trial accepts both genders and it counts for large portion of Gender
column. This itemset implies that the most of trials with relatively short length accepts both genders. The itemset {relatively_shortLen, Completed} has the second highest support of 0.437, which indicates that there are lots of trials with relatively short length are completed.
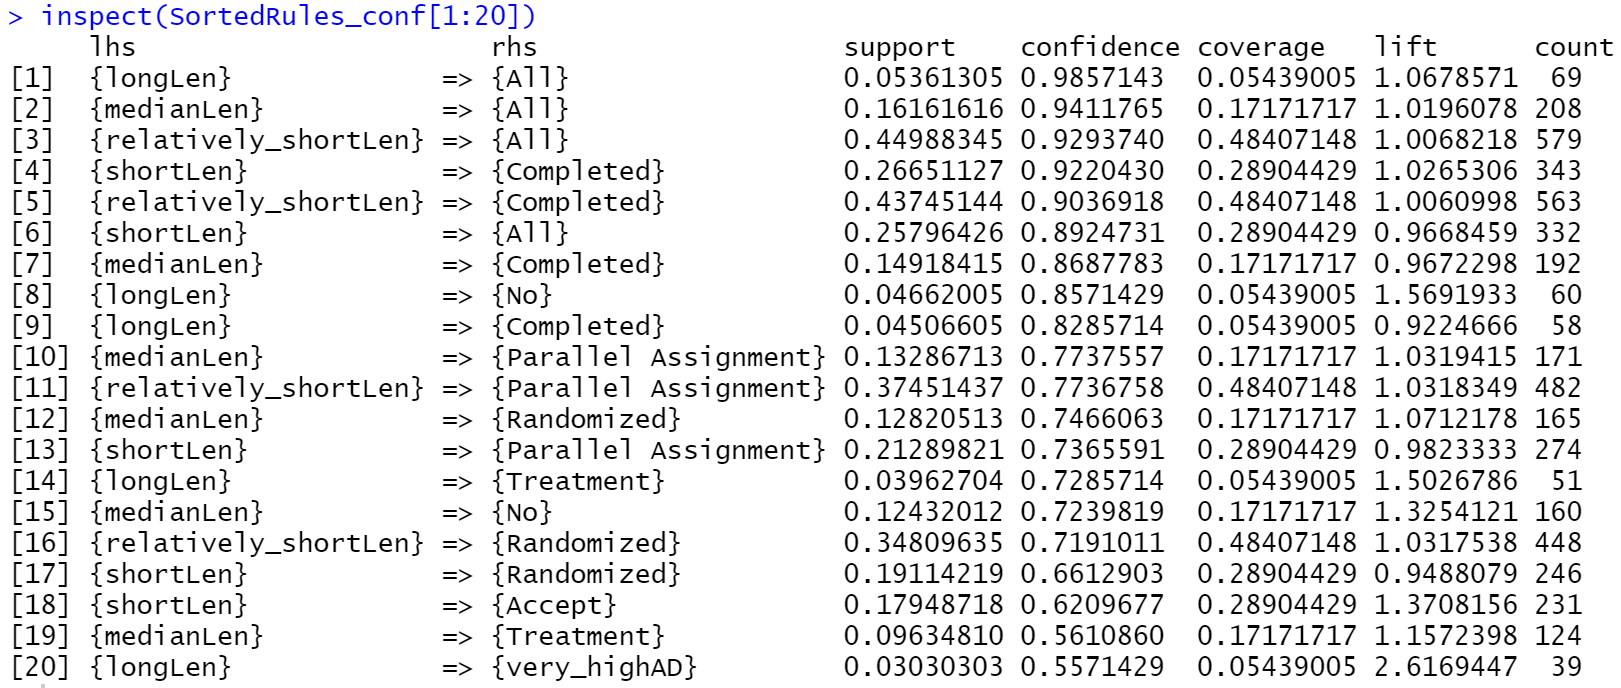
According to fig 3., 4 different labels in DurationDays
column all has itemsets {longLen, All}, {medianLen, All}, {relatively_shortLen, All} and {shortLen, All} with high confidence value. This indicates that whatever length of duration of the trial, it always employs both genders. Similar to the explanation in last part, this reflects that variable “All
under Gender
column counts for large proportion in that column.
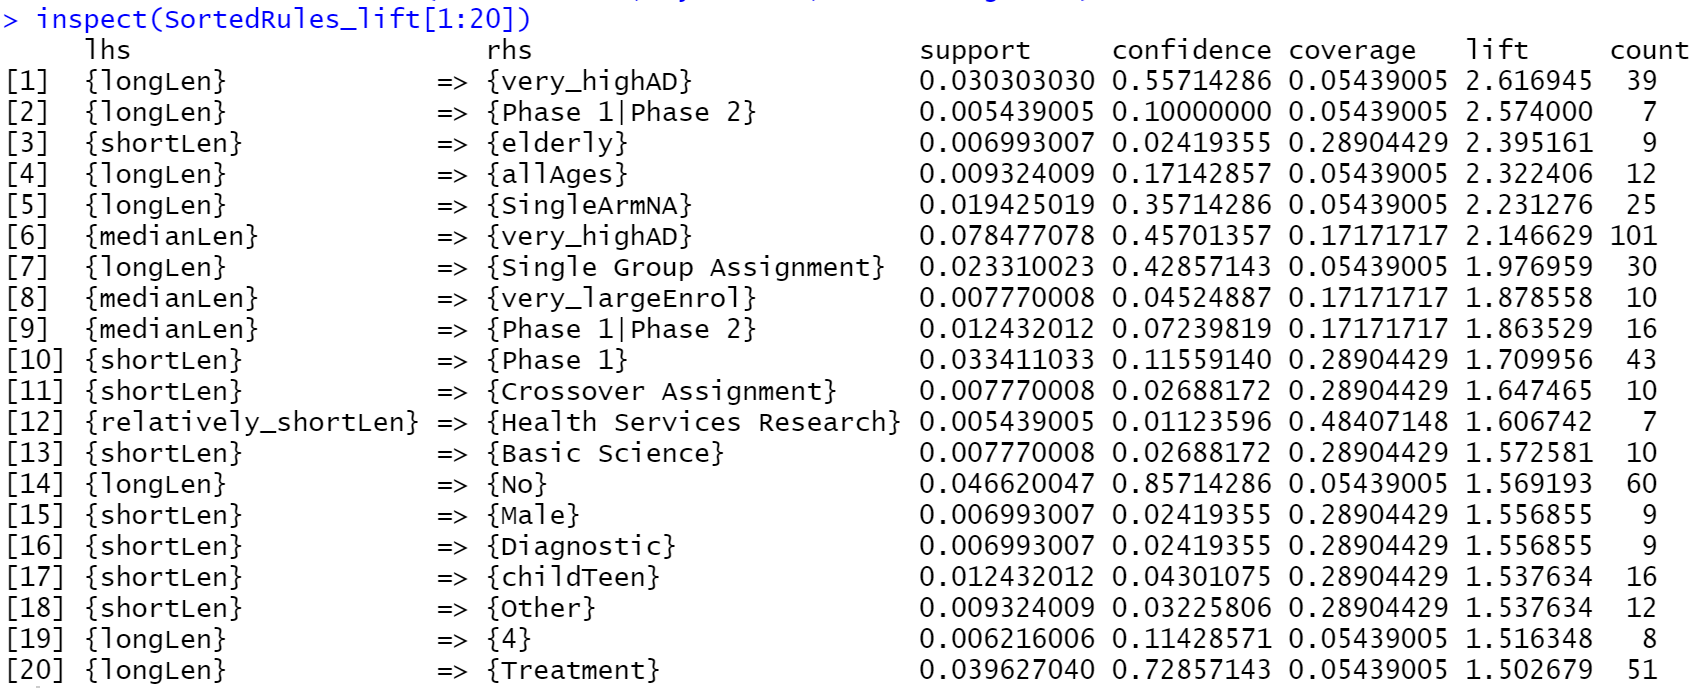
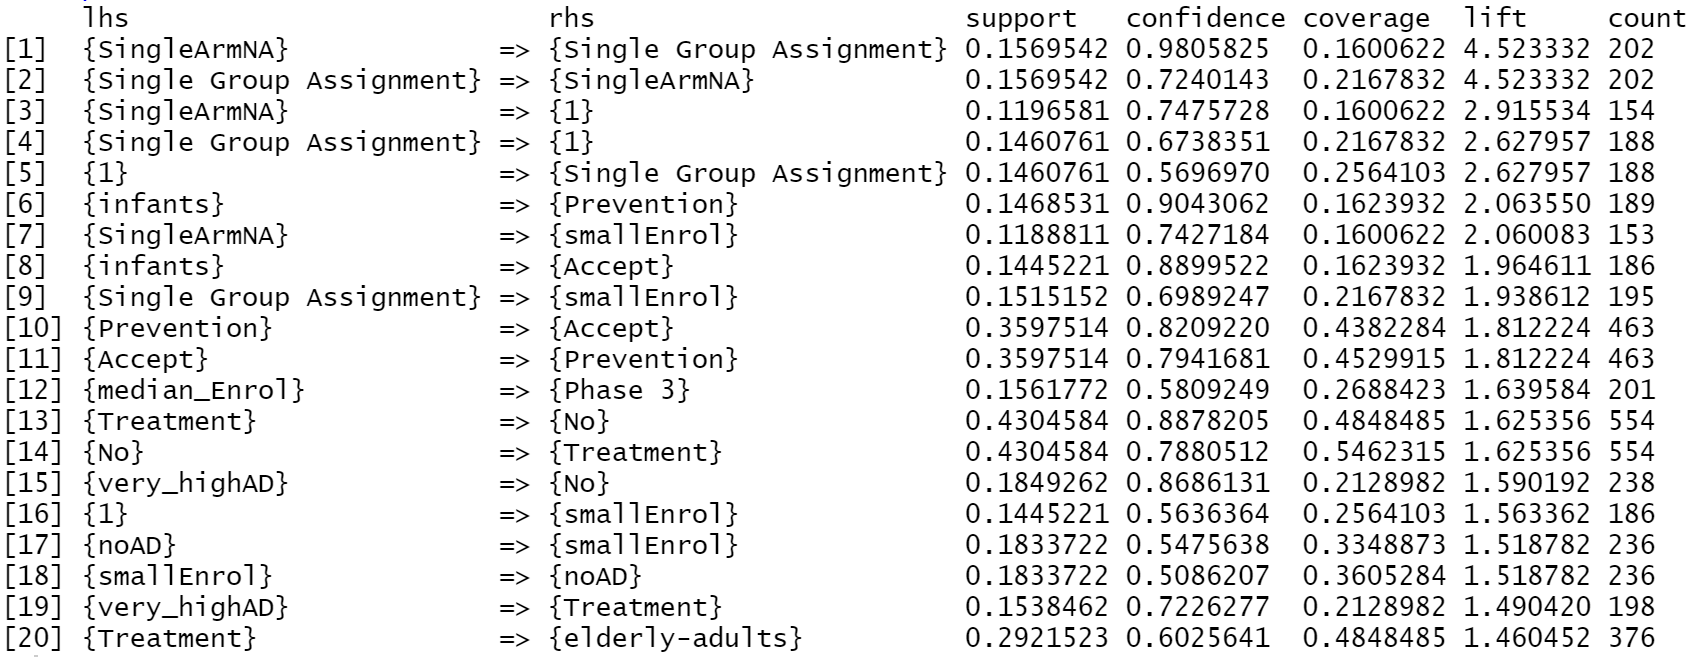
According to Fig 4, itemset {longLen, very_highAD} has highest lift value of 2.61. This indicates that the long length of clinical trials are highly associated very high rate of adverse effects and death. The itemset {shortLen, elderly} has high lift value of 2.4, which suggest the dependency of short length of clinical trials on elderly group.
3) Measures of Set Correlation for all record data
Apart from the ARM specific for DurationDays
column, this project also conduct rules on whole record dataset. Fig 5, Fig 6 and Fig 7 illustrate the Top 20 highest Support, Confidence, Lift result for all data, respectively.
Fig 5 suggests the high existence of variable Competed
, All
, Parallel Assignment
and Randomized
in the dataset.
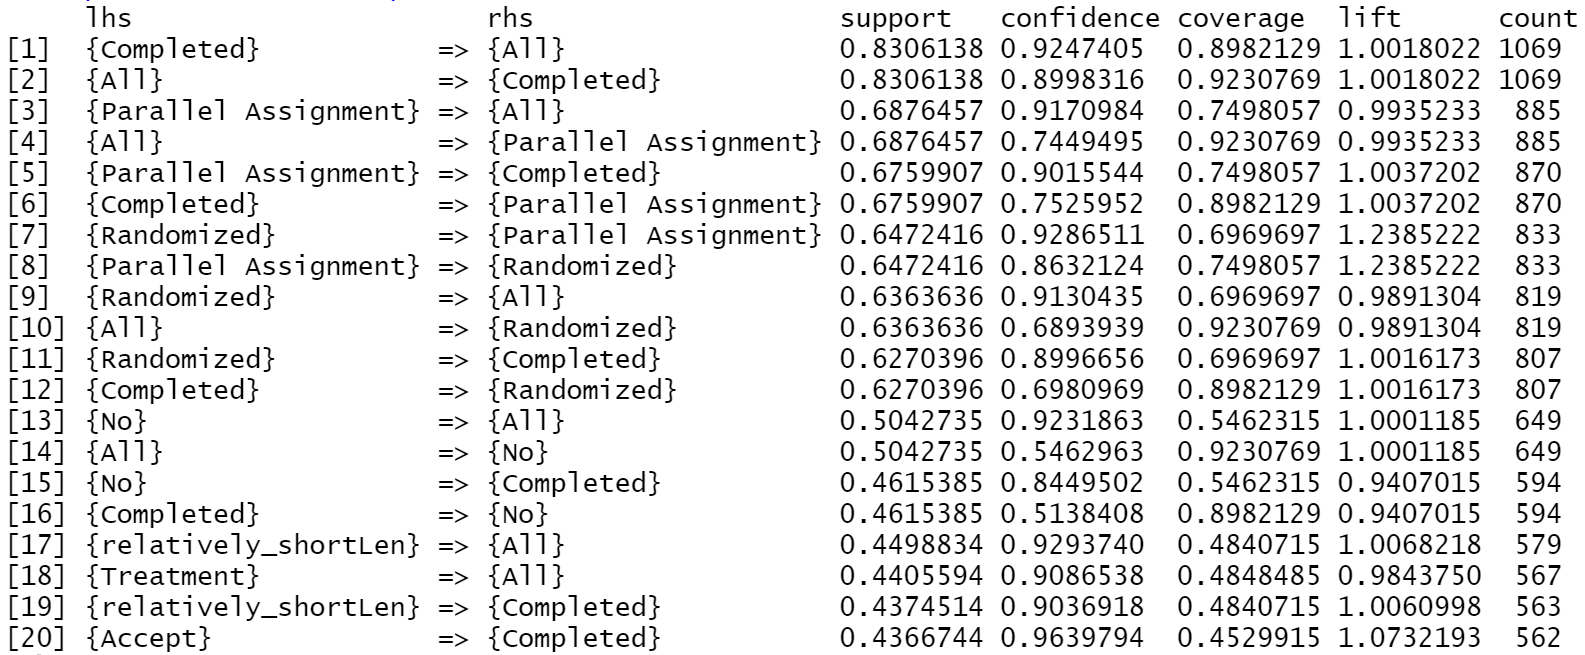
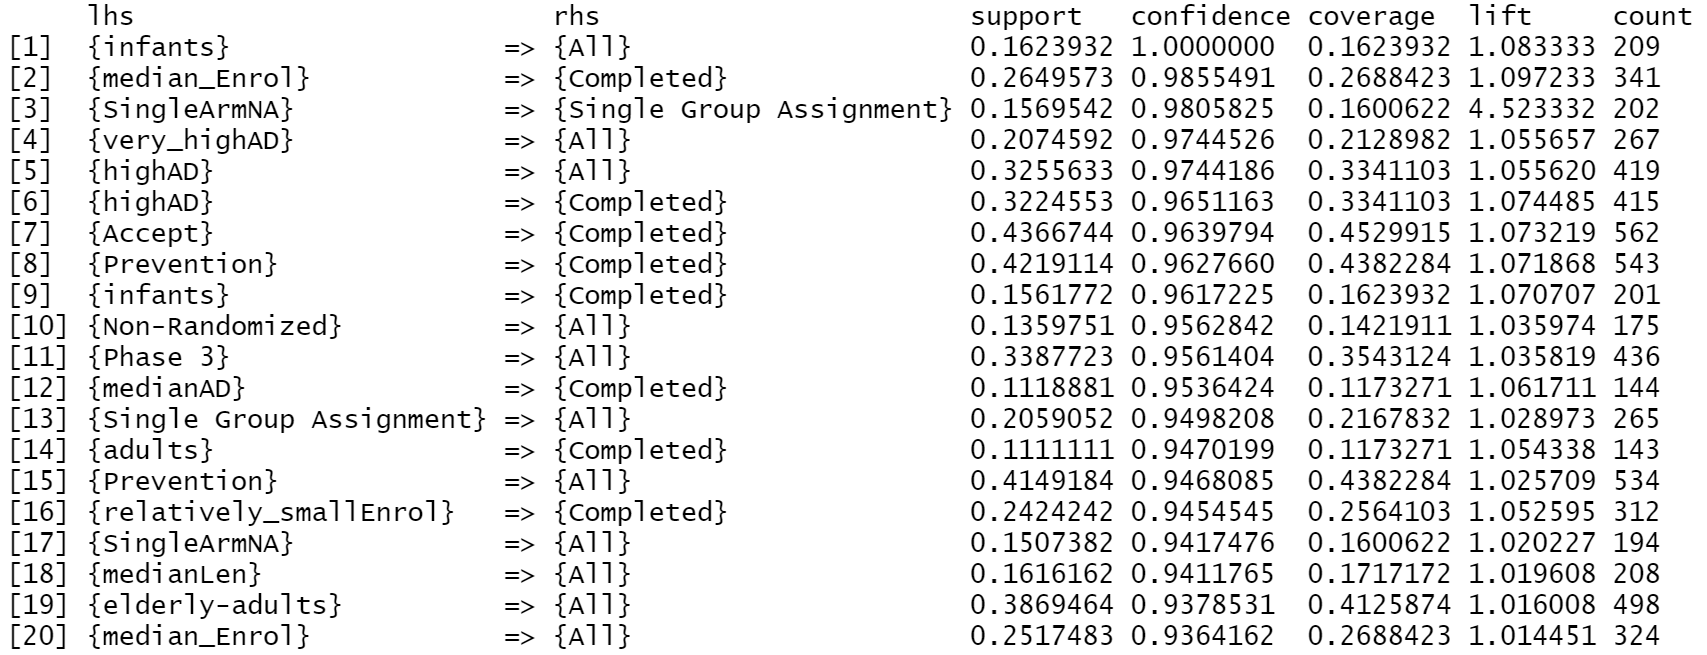
Fig 7 illustrates the high association of among items SingleArmNA
, Single Group Assignment
and 1
.
Networks Visualization
Fig 8, fig 9 and fig 10 are presenting 3 different types of networks for duration data, which are networkD3, VisNetwork and igraph. These graphs are showing same edges and nodes.
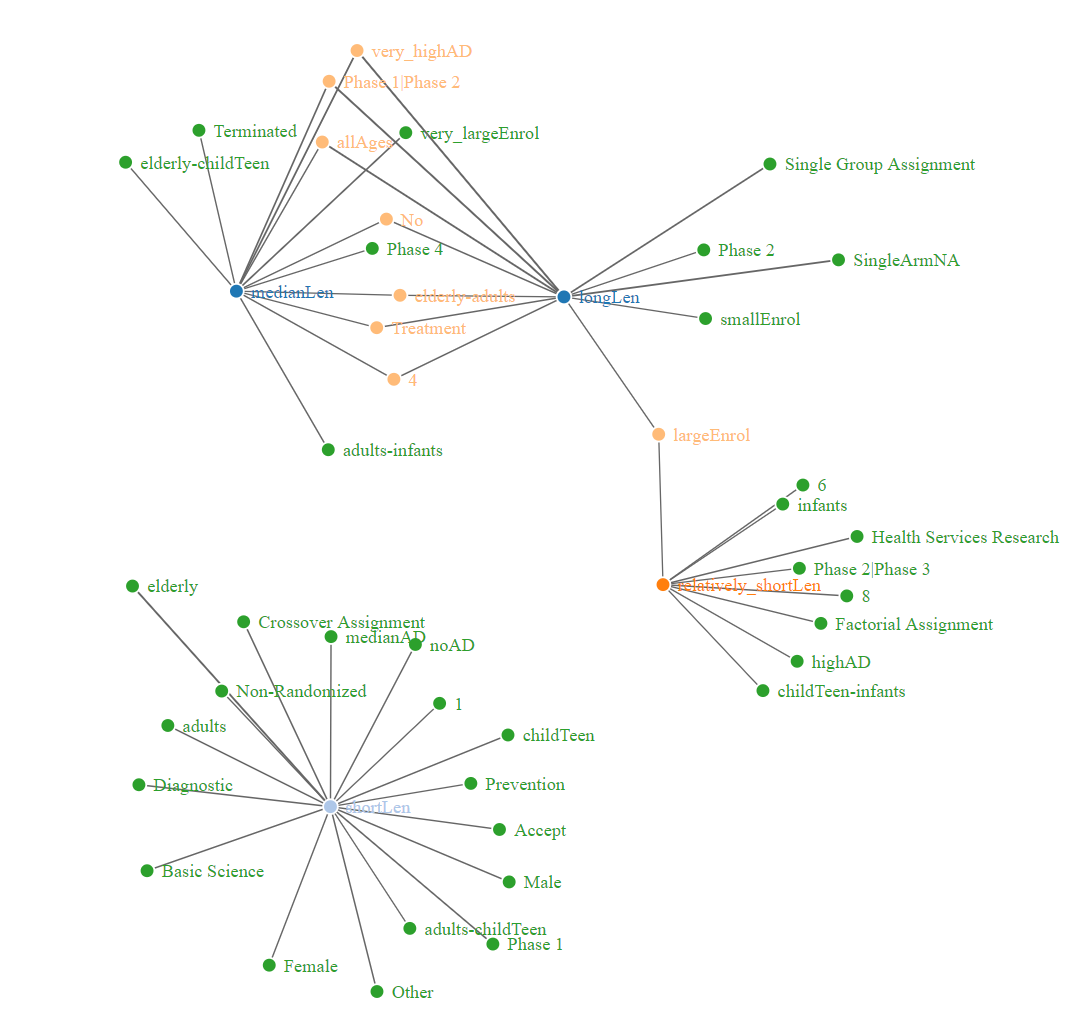
Fig.8 - NetworkD3 based on lift value for duration of clinical trials (link)
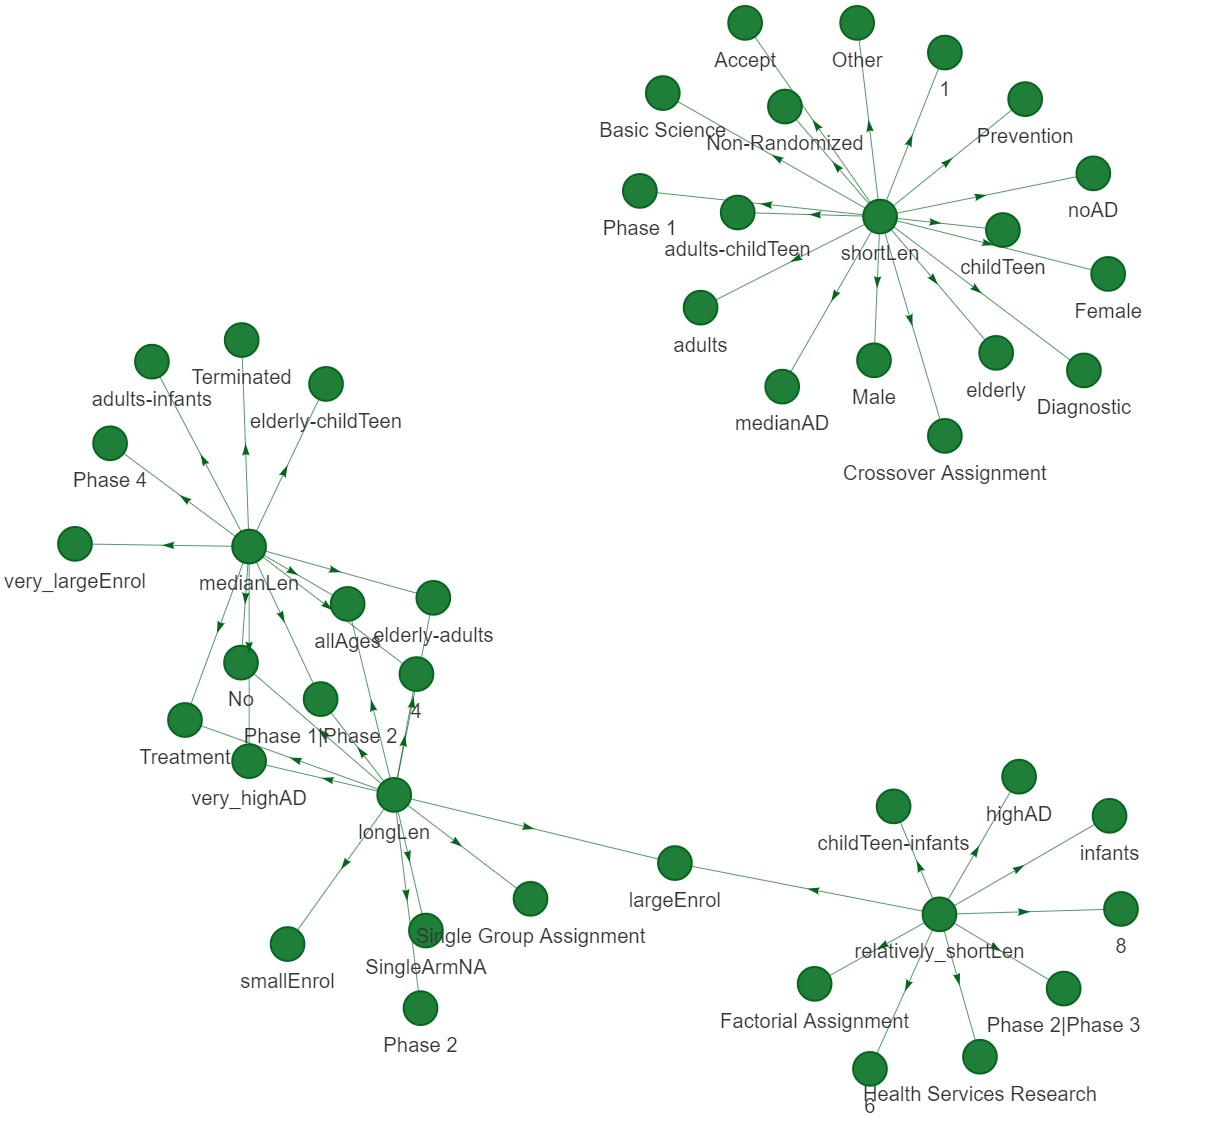
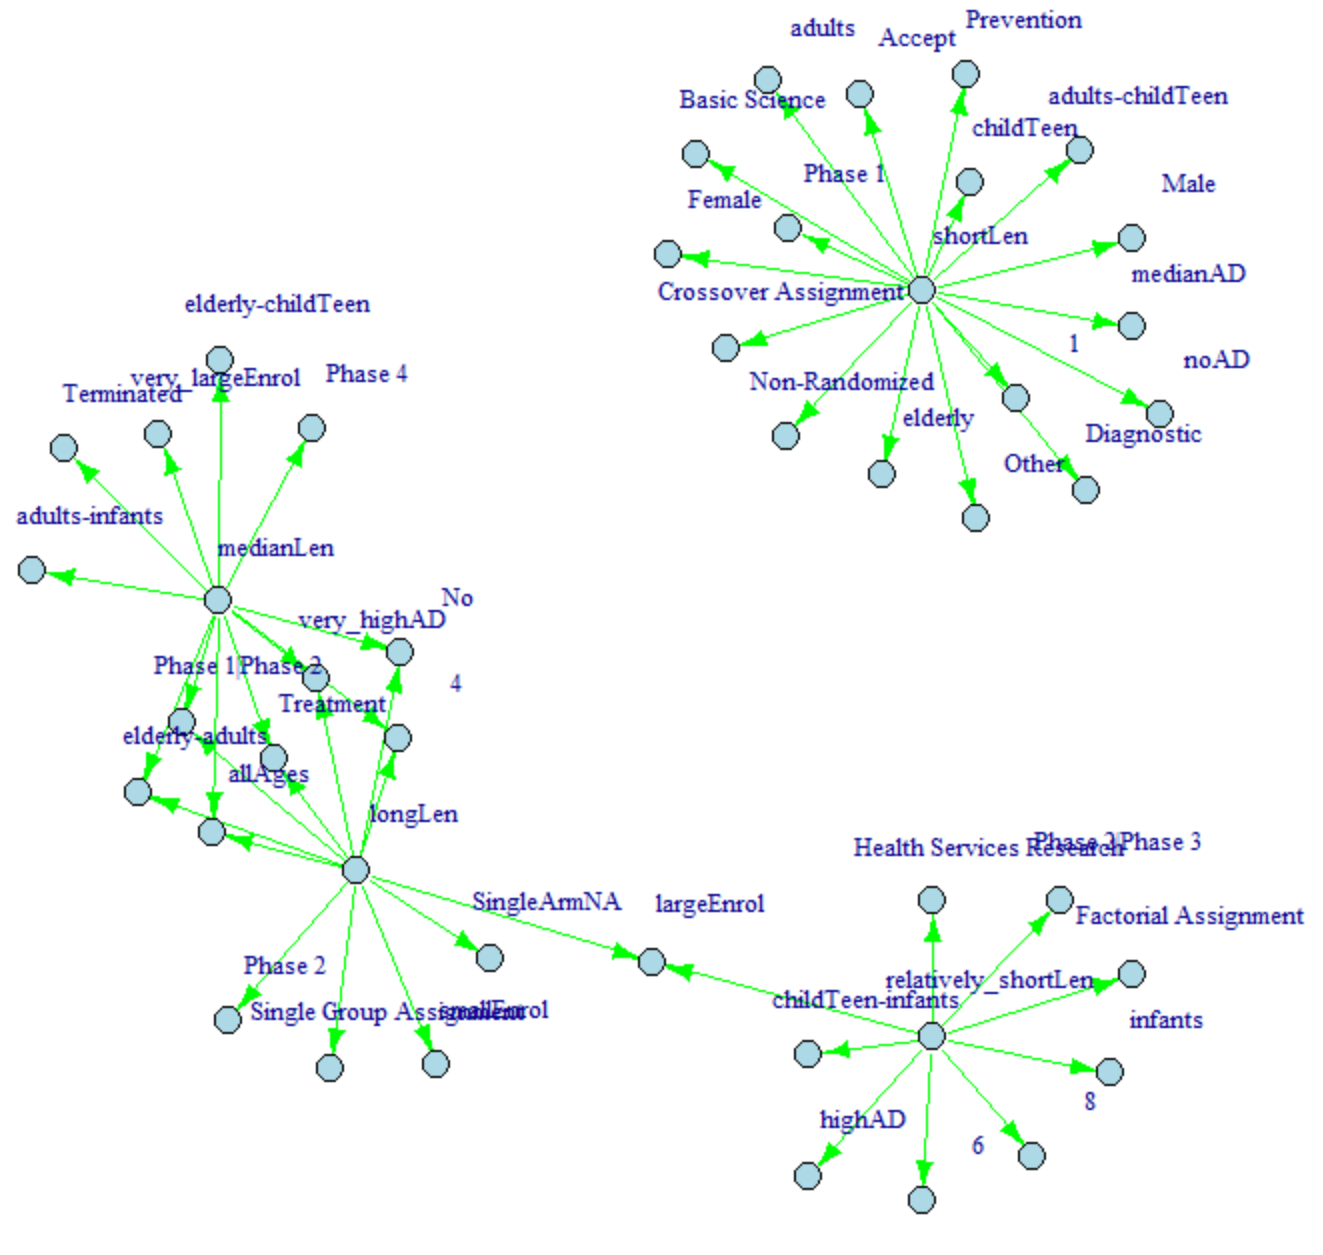
Fig 11 and fig 12 presents networkD3, and VisNetwork respectively for lift value of all data
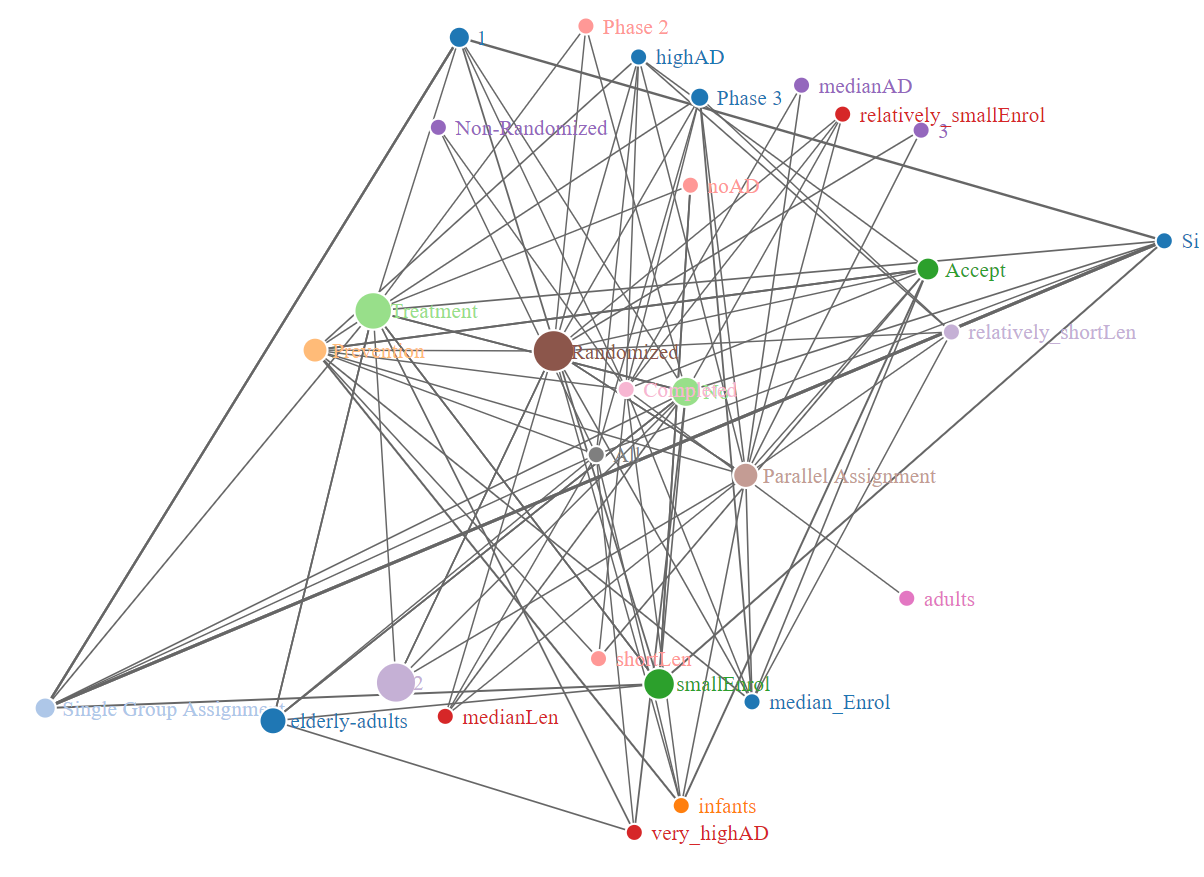
Fig.11 - NetworkD3 based on lift value for all data
Discussion
According to fig 7 and fig 12, it shows that variable 1
under ArmNumber
column, variable SingleArmNA
under column DesignAllocation
, and Single Group Assignment
under column DesignInterventionModel
have high association with each other.
This could be explained by the nature of the dataset and clinical trial. ArmNumber
column record the number of arms (subgroups of participants) in the clinical trials. DesignAllocation
column records the methods of how participants are assigned into different groups. DesignInterventionModel
is the strategy of assigning interventions to participants. If there is only 1 arm, participants neither do not need to be assigned, nor requiring special assigning strategies, thus it is labeled as SingleArmNA
in the DesignAllocation
column and Single Group Assignment
under DesignInterventionModel
.
According to the networks based on lift value for duration of clinical trials, it shows that there is clear distinguish of variables associating to long length of clinical trials and short length clinical trials.
Based on the fig 8, the green nodes are only connecting to one center, and the light orange nodes are connecting to 2 centers. The center of longLen
share lots of common nodes with center of medianLen
, while only share 2 common node with center relatively_shortLen
and no common node with shortLen
. This graph clearly illustrate how the presence of different variables affect the length of clinical trials.
Link this graph to the fig 4, the long length of clinical trials shows the highest association with very high rate of adverse effects and death.
This make sense since if a medicine are highly possible of causing adverse effects or death, the research would take longer time to find the solution of lowering the risks of medicine. Besides that, the short length of clinical trials has high dependency on elderly group. Since elderly group are vulnerable and more susceptible to adverse effects of drugs, it makes sense that the clinical trials on elderly group take short length.
To sum up, knowing associations of variables to duration of clinical trials greatly facilitate the prediction of the length.